Global Environmental Action Plan

Working to realize the Global Environmental Vision
In conjunction with to the implementation “TOTO Global Environmental Vision”in 2014, the 9th Global Environmental Action Plan has also been implemented.
We have been accelerated our efforts as one TOTO Group to resolve global social issues such as water shortages and global warming.
We have been accelerated our efforts as one TOTO Group to resolve global social issues such as water shortages and global warming.
9th Global Environmental Action Plan FY 2016 Results
| Evaluation index (KPI) | Scope | Standard year and value | FY2017 target | FY2016 target | FY2016 result | Evaluation | |
|---|---|---|---|---|---|---|---|
| Contribution of improvement in water efficiency of products contribution to waster-saving (Amount of contribution from performance improvement from 2005 ) |
Japan/overseas | - | 700 million m3 |
700 million m3 |
740 million m3 |
○ | Achieved target due to the increase in sales of water-saving toilets. |
| Shipment ratio of water-saving toilets (Water per flush of 4.8L or less) |
Japan | - | 70% | 70% | 79% | ○ | Result greatly exceeded the target value. |
| Overseas | 80% | 70% | 68% | △ | Almost achieved target and the plan is almost going on schedues. | ||
| Contribution to global reduction in CO2 emissions from improvement in water and energy efficiency of products (Amount of contribution from performance improvement from 2005) |
Japan/overseas | - | 3.3 million tons | 2.99 million tons | 3.06 million tons | ○ | Achieved target due to expanding water saving and energy saving products. |
| CO2 emission from business sites | Japan/overseas | FY2013 emission 313 thousand tons | 352 thousand tons or less | 351 thousand tons or less | 328 thousand tons | ○ | Achieved target due to the replacement of the facilities and the increase in productivity. |
| Amount of CO2 reduction form initiatives in business sites |
Japan/overseas | FY2013 reduction 0tons |
29 thousand tons | 21.4 thousand tons | 24.6 thousand tons | ◎ | Achieved target greatly due to continuous implementation of reduction initiatives. |
| Reduction of fuel used for transportation per unit |
Japan | FY2009 0% |
11.0% | 11.1% | 10.6% | △ | Not achieved target in spite of proactive initiatives of promotion. |
| Recycling rate in production sites | Japan | FY2013 99% or more |
99% or more | 99% or more | 100% | ○ | Continuously maintained 99% or more. |
| Recycling rate in production sites *Recycling target with provisions |
Overseas | FY2013 70% |
90% or more | 85% | 93% | ○ | The target has been achieved through measures such as encouraging the reuse of ceramic waste. |
| Violations of related environmental regulations |
Japan | - | - | 0 | 0 | ○ | Promoted continuous enhancement of environmental management system. |
| Percentage of “legal + recycled materials” used *Legal materials include material from certified forests |
Japan | - | 100% | 99% or more | 99% | ○ | The percentage is increasing as planned. |
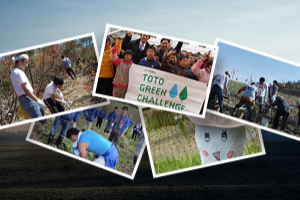
| Participation rate of all volunteer activities (participation rate =ratio of total number of participants to number of all employees) |
Japan/overseas | - | 100% | 100% or more | more than 100% | - | The total number of participants is 49,300. |